
Coding
Excel’s math and trigonometry functions unlock powerful data analysis capabilities—whether you’re calculating distances, financial projections, or scientific measurements. Master these 10 essential functions to transform raw data into actionable insights with precision.
SUM Function for Basic Arithmetic Calculations
Need to add up sales figures, track monthly budgets, or tally inventory without manual calculations? The SUM function in Excel is your go-to tool for effortless arithmetic—with just three characters (=SUM()), you can automate totals across entire rows, columns, or even non-adjacent ranges.
Type =SUM(range) to instantly calculate totals, or use auto-fill to apply it across multiple cells. For example, =SUM(B2:B10) adds values from cells B2 through B10, while =SUM(B2, D5, F10) sums specific cells. Excel even handles empty cells by ignoring them, and the function updates automatically when data changes—no recalculating required.
This is the first function every Excel user should master, whether you're managing a small business ledger or analyzing large datasets. Start with SUM, and you’ll build confidence for tackling more complex formulas. 💪
AVERAGE Function for Statistical Analysis
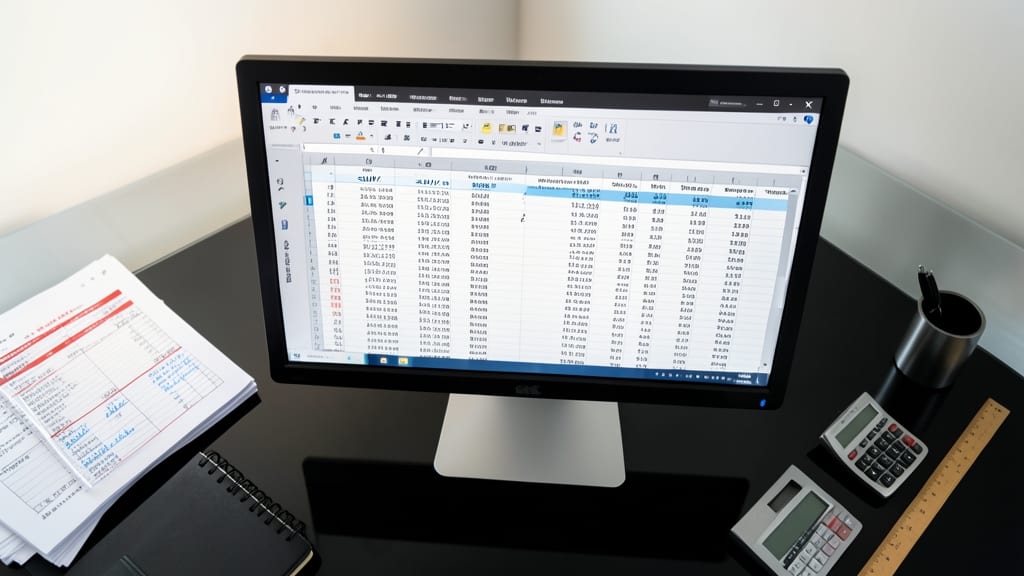
Need to spot trends in test scores, server uptime, or IoT sensor data? The AVERAGE function instantly calculates the mean value across entire columns or ranges—no manual addition required.
Simply type =AVERAGE(range), and Excel handles the rest, ignoring empty or text cells automatically. It’s perfect for performance metrics (like CPU load averages) or financial analysis (monthly expense trends). The function even supports array inputs, so you can average dynamic ranges without updating formulas.
Teachers, engineers, and data analysts rely on this for quick insights—ideal when you need a single number to represent the "typical" value in your dataset. ✨
SQRT Function for Square Root Calculations

Need to calculate distances, areas, or standard deviations without breaking out a calculator? The SQRT function in Excel handles square roots instantly—whether you're working with Pythagorean theorems, financial volatility metrics, or geometric designs.
Simply type =SQRT(number), and Excel returns the square root of your input. For example, =SQRT(25) yields 5, while =SQRT(10) gives 3.16227766. It’s also perfect for nested calculations, like combining it with POWER for advanced formulas. No manual approximations needed!
Engineers, architects, and data analysts will find this function indispensable for precision calculations—ideal for projects where accuracy matters most. ✨
SIN and COS for Trigonometric Measurements
Need to turn angles into coordinates for engineering projects, navigation systems, or wave analysis? Excel’s SIN and COS functions let you calculate precise x/y values from any angle—just remember they work in radians, not degrees.
Use =SIN(angle) to find the vertical component (y-axis) and =COS(angle) for the horizontal (x-axis). For example, =SIN(RADIANS(30)) converts 30° to its sine value. Pair them with PI() for circular motion calculations or ATAN2() for reverse lookups.
Engineers, game developers, and data scientists rely on these for everything from robotics pathfinding to signal processing. Start with small angles to avoid overflow errors! ✨
PI Function for Circle-Based Calculations

Forget memorizing π’s 15-digit value—Excel’s PI() function delivers the precise value you need with a single keystroke. Whether calculating pipe sizing in HVAC systems or designing circular foundations in architecture, this function ensures accuracy without manual input errors.
Simply type =PI() to return 3.14159265358979 (15 decimal places), then combine it with radius or diameter values in formulas like **=2PI()radius for circumference or =PI()*radius²** for area. No hardcoding means fewer recalculations when specs change—ideal for iterative design processes.
Engineers, architects, and lab technicians rely on this function to maintain precision in blueprints or experimental setups. ⚡
POWER Function for Exponential Growth Models

Modeling real-world growth—like investments or bacterial cultures—just got simpler with Excel’s POWER function. Whether you’re projecting loan interest at 5% annually or tracking radioactive decay, this formula handles exponential calculations with precision using just two inputs: your base value and the exponent.
The syntax =POWER(number, power) lets you adjust the exponent dynamically, making it perfect for scenarios where rates change. For example, calculate compound interest by raising (1 + rate) to the power of years, or simulate population growth with time-based exponents. It even works for negative exponents to model decay processes like drug metabolism.
Finance professionals and biologists will love how it simplifies complex scenarios without manual iteration. Try it with your next dataset—it’s the secret weapon for exponential analysis. ✨
ROUND Function for Clean Data Presentation
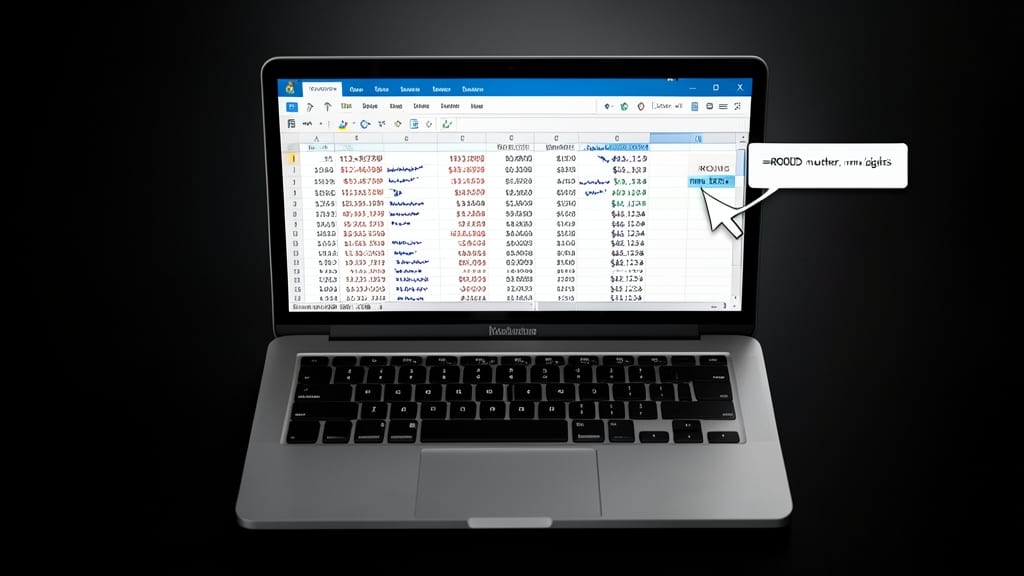
Tired of messy spreadsheets with inconsistent decimal places? The ROUND function lets you control precision effortlessly—whether you're formatting prices, measurements, or financial reports. It’s the secret weapon for keeping data clean while preserving accuracy.
With just two arguments—number and num_digits—you can round up, down, or to a specific decimal place. For example, =ROUND(3.14159, 2) returns 3.14, perfect for currency displays. Need to round to the nearest whole number? Use =ROUND(2.9, 0).
Accountants, engineers, and marketers rely on ROUND to standardize outputs—eliminate visual clutter while ensuring stakeholders see the numbers they need. ⚡
ATAN2 Function for Advanced Angle Calculations

When ATAN leaves you guessing which quadrant an angle belongs to, ATAN2 steps in with precision—calculating angles based on both x and y coordinates for flawless results in any direction. Unlike its simpler counterpart, this function resolves ambiguity by accounting for the full 360-degree plane, making it indispensable for complex calculations.
The syntax =ATAN2(y,x) returns the angle in radians between the positive x-axis and a point defined by (x,y), handling all four quadrants automatically. For example, use it to calculate GPS bearing angles between two coordinates or simulate robot arm movements with exact rotational paths. It even works seamlessly with Excel’s DEGREES() function to convert outputs to degrees for readability.
Engineers, physicists, and data scientists will find ATAN2 invaluable for vector analysis, navigation systems, or physics simulations where directional accuracy matters. Try it next time you need more than just a basic angle—your calculations will thank you. ✨
FACT Function for Permutations and Combinations
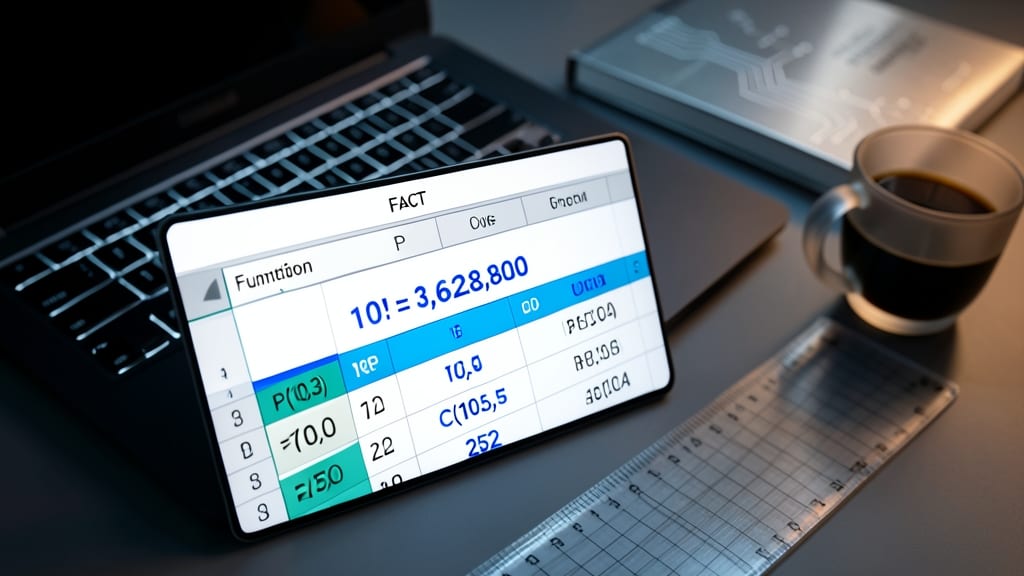
Need to crunch numbers for probability models, cryptography, or statistical analysis? The FACT function in Excel computes factorials instantly—no manual multiplication required. Whether you're calculating permutations for a lottery simulation or evaluating combinatorial probabilities in data science, this function saves hours of tedious work.
Simply type =FACT(number) to compute the factorial of any positive integer (e.g., =FACT(5) returns 120). Excel handles values up to 170! (factorial of 170), making it perfect for large-scale calculations. For cryptography, factorials help model key distribution scenarios, while statisticians use them to normalize distributions.
This function is a game-changer for researchers, engineers, or anyone working with advanced mathematical models. ⚡
RAND Function for Probability Simulations

Need to simulate unpredictable outcomes without breaking a sweat? The RAND function generates random decimal numbers between 0 and 1—perfect for testing algorithms, modeling risk, or even designing board games. Unlike static data, these values refresh every time you recalculate, making it ideal for dynamic scenarios.
With zero arguments required, you can drop =RAND() into any cell and instantly get a new value. Pair it with RANDBETWEEN for custom ranges (e.g., rolling dice or shuffling decks) or use it in Monte Carlo simulations to model thousands of possible outcomes. The function’s simplicity hides its power—no complex setup, just pure flexibility.
Game designers and financial analysts love RAND for prototyping, while educators use it to teach probability. Press F9 to recalculate and watch your numbers dance—no coding required! ✨